February 20, 2020 · Blog Posts
What is Value-at-Risk and How Does Rival Calculate it?
Value-at-Risk or VaR is a key component of our enterprise risk management platform. VaR measures the potential loss for a portfolio of diverse instruments at a given probability and span of time. Unlike traditional risk scenarios where all of the instruments are shocked by the same percentage change in price, VaR takes into account the correlations across products to more accurately reflect the diversification of uncorrelated products and the degree of hedging that could take place between correlated products. VaR can be calculated using the variance-covariance method, historical simulation, or Monte Carlo simulation.

Monte Carlo Simulations
Monte Carlo Simulations are the most advanced and accurate way to calculate VaR. It allows risk managers to generate a large sample of price movements that fit within the expected distribution level for the underlying product prices, given a specific time frame and volatilities for the underlying products.
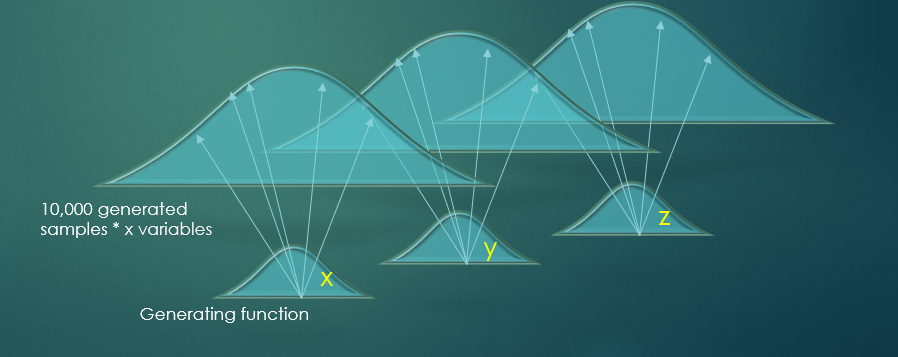
With our enterprise risk management solution, we run Monte Carlo simulations on the entire portfolio at once, so it captures non-linear interactions among positions in correlated products. For example, it can account for offsetting options positions in products that tend to move together, such as WTI and Brent crude, or Soybeans, Soy oil or Soy meal.
How Do Monte Carlo Simulations Work?
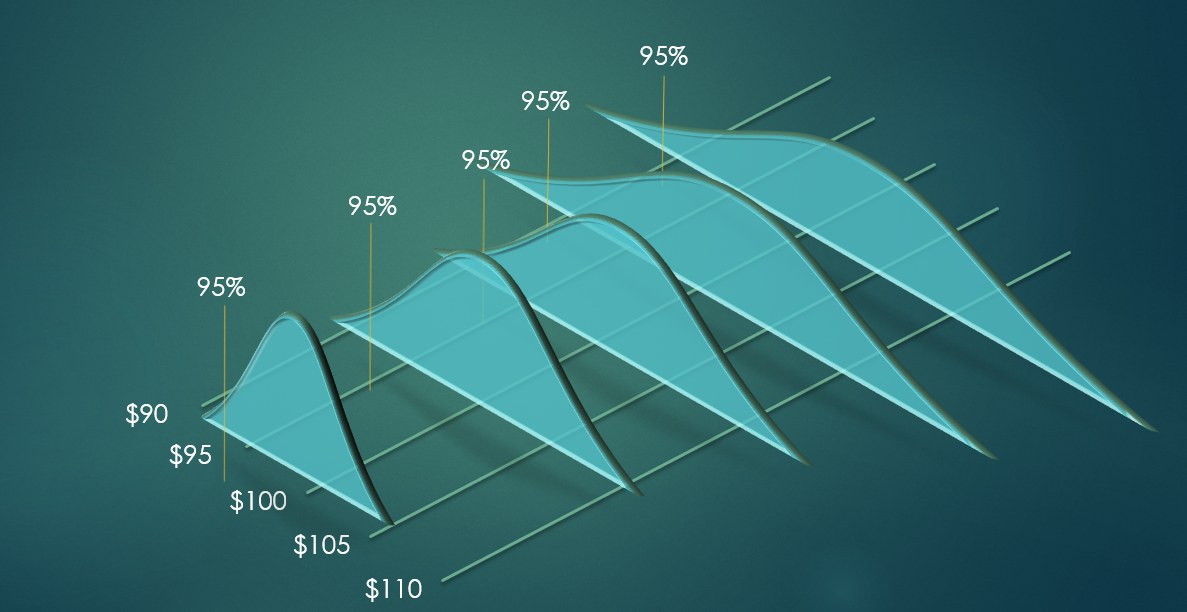
For each simulation iteration, a random price is generated for each underlying product, conforming to each product’s price distribution. In generating sample prices, correlations between products are considered. This means that even though random sample prices are generated, the resulting sample prices will be correlated to the same degree that we observe in historical data. We obtain these correlations by calculating the actual correlations between the various products’ day-over-day price changes in a historical database going back two years. These correlations are then combined with current market volatilities to generate sample prices. The result is a set of prices that reflect correlations shown to hold over time, but also responding to current market volatilities.
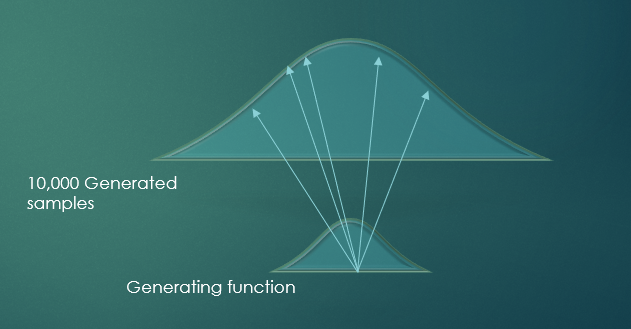
Using a product’s generated price, each simulation calculates the gains and losses for the product and its derivatives. It then sums up the gains and losses across products at a portfolio level. This is done repeatedly to generate a large random sample of prices and P&L results – we currently run 10,000 simulation iterations for each underlying. The results are then sorted by P&L gain, and the 95% or user-defined confidence level worst loss is found, which is the Value-at-Risk result.
Within our VaR functionality risk managers can also view other statistics including mean, standard deviation, skew, kurtosis, and expected tail loss.
If you’re interested in learning more about Value-at-Risk and other features available in our enterprise risk management solution, contact us today.